- On Monday, Litecoin posted very modest gains, only 0.7% at the start of the week.
- Despite initial gains, the formation of price action still seems worrying.
- The LTC / USD price range has shrunk, after the strong sales pressure last week, it may be that the bears take a break before a further fall.
LTC / USD daily chart
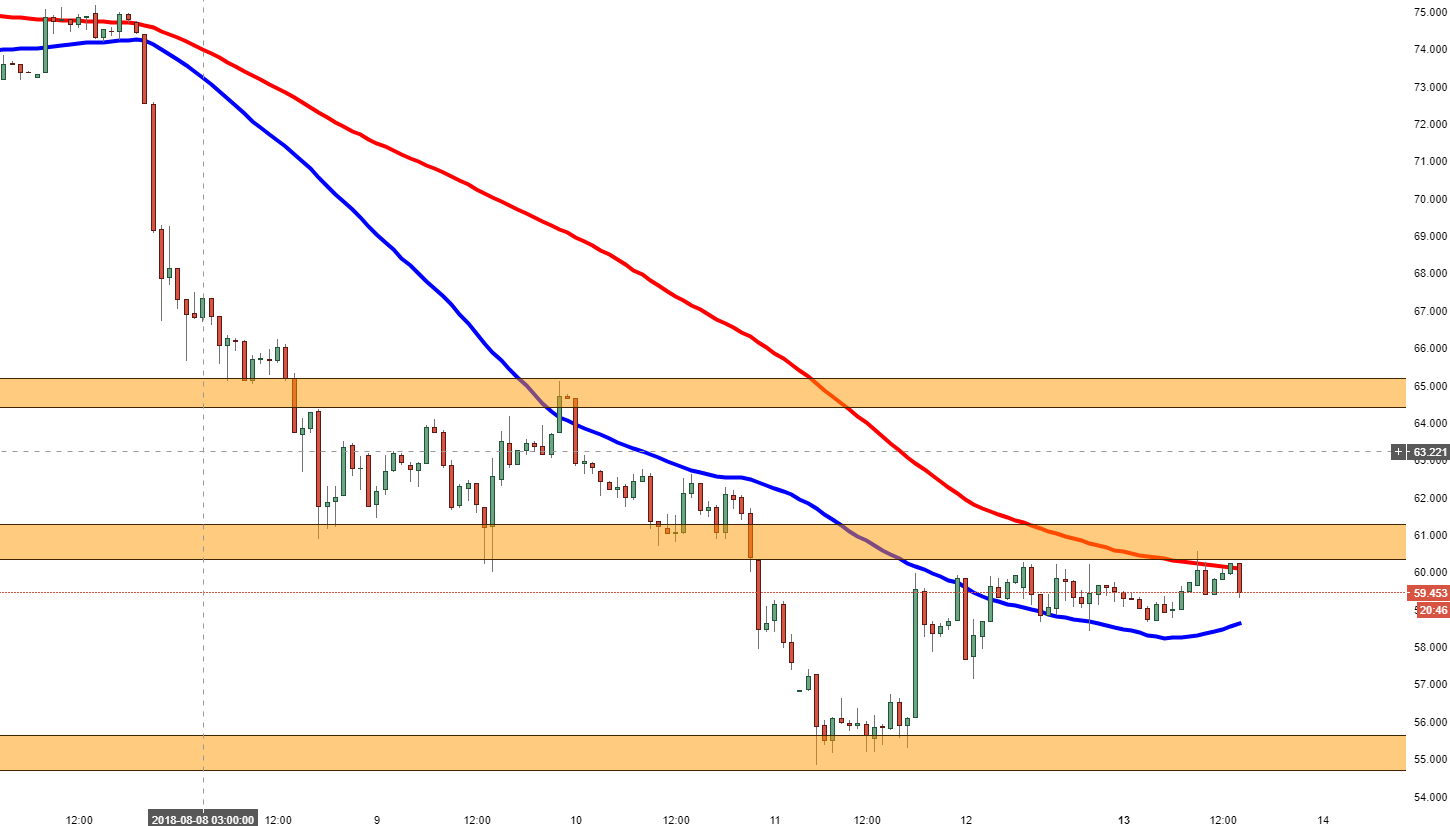
Spot rate: 59.719
Relative change: + 0.70%
High: 60.547
Low: 58.657
Trend: bullish
Resistance 1 : 60.150, 100MA.
Resistance 2: 60,500, supply input.
Resistance 3: 61.300, (resistance on the 60 minute chart).
Support 1: 58.699, 50MA.
Support 2: 57.655, (support on 60-minute chart).
Support 3: 55.555, demand area, low area of 11 August.
Get the 5 most predictable currency pairs
