- Litecoin nursing losses of more than 1.5%, while continuing to be affected by sales pressure.
- LTC / USD met a strong resistance between $ 77-75, being forced to know the defense of $ 70 territory.
- The eyes recorded a new low between August 4 and 5, which marked the lowest level since November 2017 to $ 72.155.
LTC / USD 4 hour chart
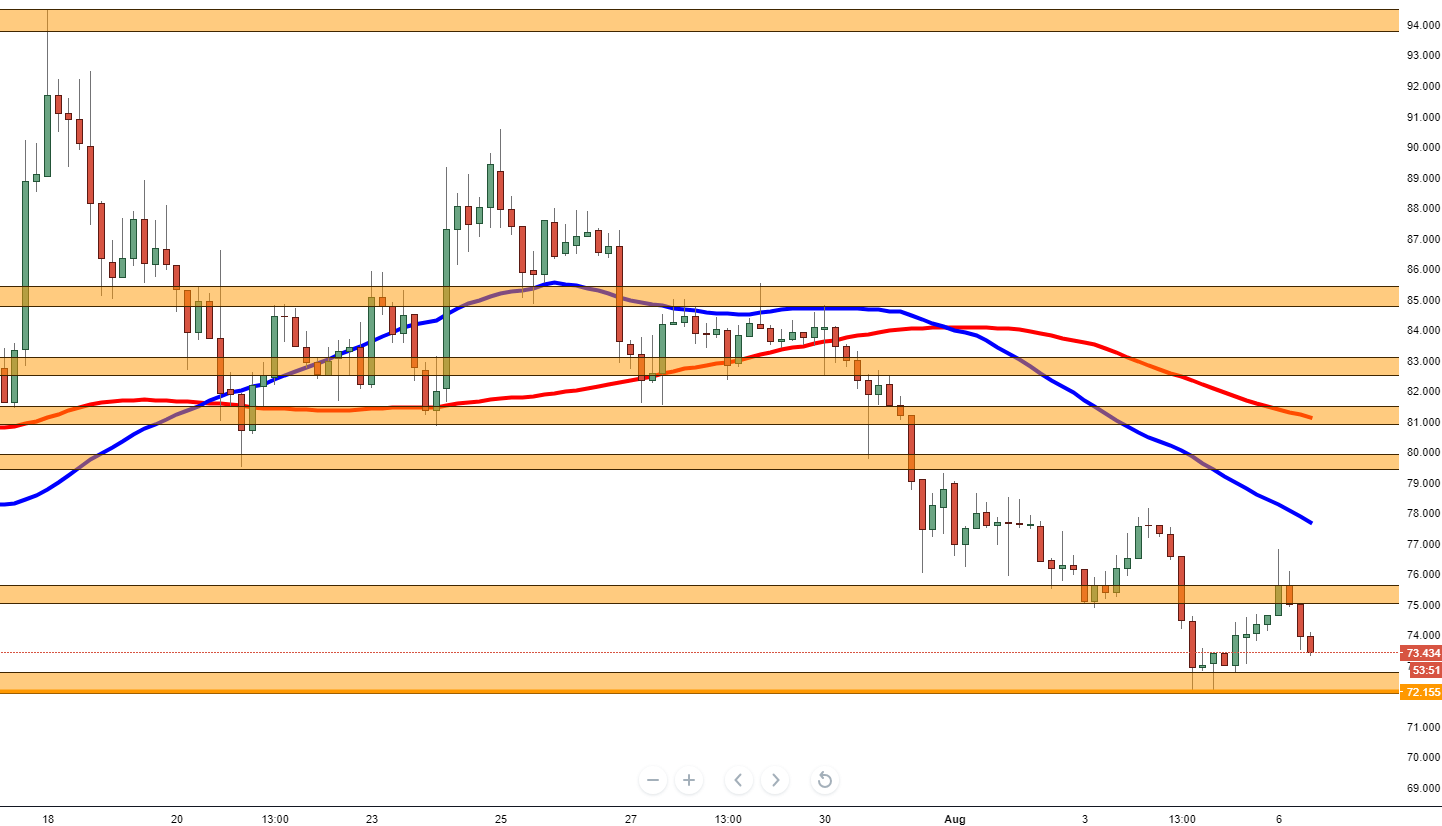
Spot rate: 73.434
Relative change: -1.60%
High: 76.789
Low: 73.280
Trend: Bearish
Support 1: 73.061, (support on the 4-hour chart).
Support 2: 72.750, entry required area.
Support 3: 72.155, 4 and 5 August low, (minimum 9 months)
Resistance 1: 75.000, refueling area.
Resistance 2: 77.550, 50MA.
Resistance 3: 76.550, 100MA, supply zone and minimum of 21 July.
Get the 5 most predictable currency pairs
