 [ad_1]

BTC / USD
BTC / USD is trading at $ 3,427 in the correction. For the last trading day, the technical model of the currency has not changed at all. Therefore, today we summarize the analytical results for the mining industry. From the beginning of November, the price of Bitcoin has decreased by about 45%. The network hashrate lost about 31% during this period. This figure is identical to about 1.3 million disabled mining devices. This trend has led to a significant reduction in the complexity of Bitcoin extraction. For the first time from October 2011 to December 3 of the current year, the complexity of the mining sector fell by 15.13%. All this, together with the general fall in prices, is an indicator of the critical state of the mining industry and a further factor that affects the downward correction of the market. Undoubtedly, the fall in the price of cryptocurrency has made mining unprofitable. However, there are positive points. It has become easier to dig 15% for those who are still mining. This increases the profitability of mining per unit of computing power. Such a correction of the complexity and the hashrate of the network makes mining more profitable and a part of the miners in the future can resume mining.
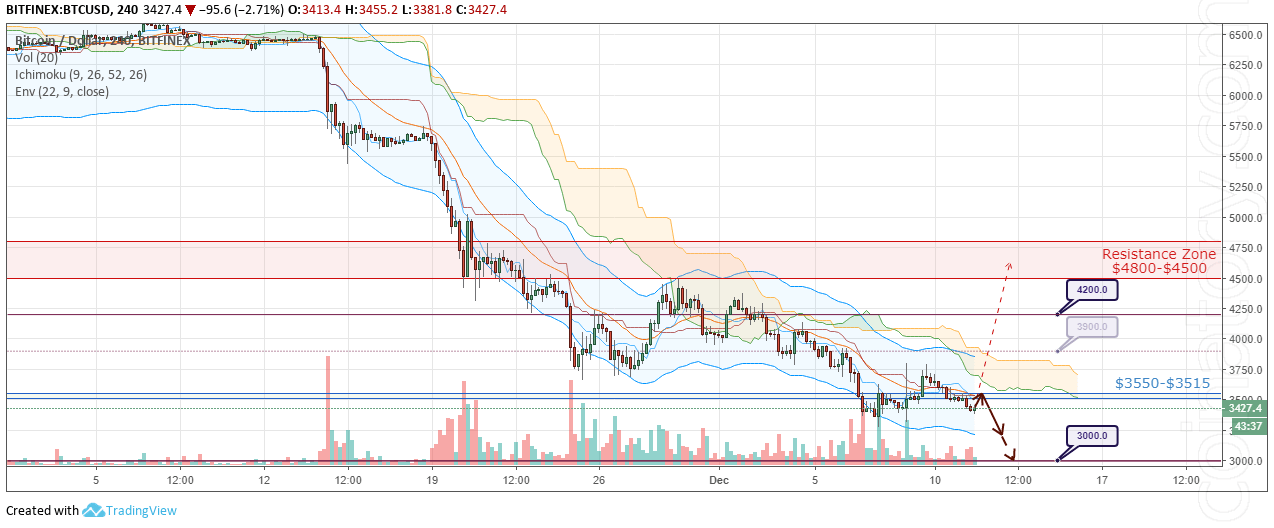
As part of the December 12 forecast, we can expect the continuation of the corrective movement in the range of $ 3.855- $ 3.288. The signal area is very narrow and ranges from $ 3,550 to $ 3,515. This is a dynamic area of the "balance" of the price of assets for the following day. The price will tend to return to this value after moving it higher or lower. For now, it is lower and it is likely that the price will put it to the test again, and then continue to decline towards the region of $ 3,210 – $ 3,000.

An alternative would be the development of a complete correction towards the top. For starters, the price will have to exceed $ 3,900 and reach the first goal of $ 4,200. After fixing at these levels, we can expect growth in the region of $ 4,800 – $ 4,500.
ETH / USD
ETH / USD is trading at $ 88.35 in the correction. From the beginning of December, the price of the currency has decreased by 22%. The coin shows a depressing inability to consolidate, day after day, at least at a level of support. This suggests that in the near future the minimum of the whole fall will be renewed again. Also, by looking at the monthly chart, we can say that the next support area will probably be the May 2017 minimum. This means a return to $ 65.00.
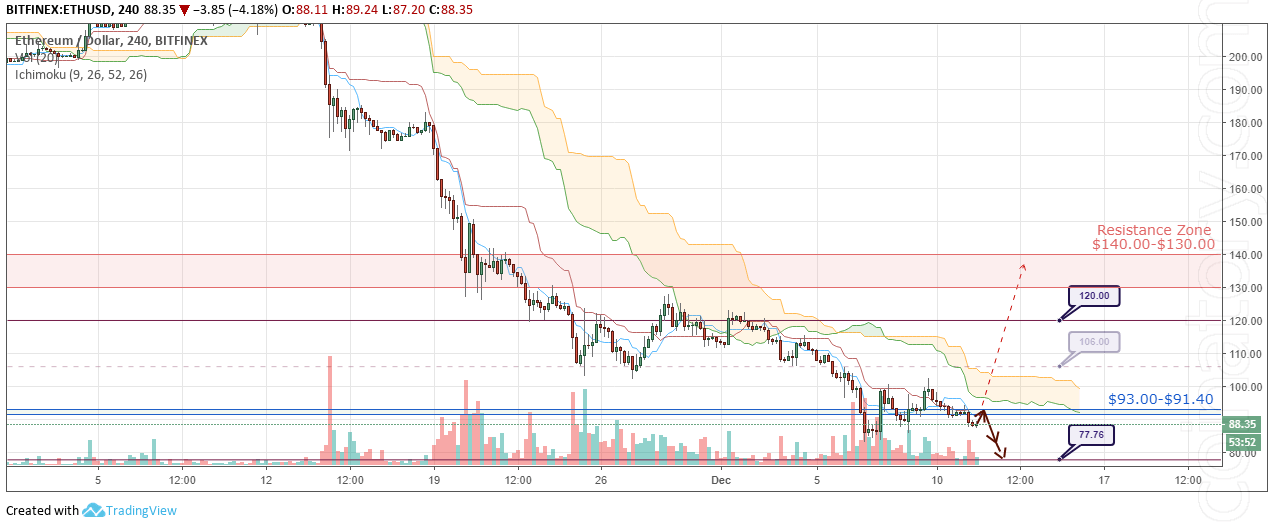
As part of the forecast for 11, we can expect the continuation of the corrective movement in the range of $ 101.25 – $ 84.45. The signal area is at $ 93.00 – $ 91.40. This is a dynamic area of the "balance" of the price of assets for the following day. The price will tend to return to this value after moving it higher or lower. For now, it is lower and it is likely that the price will put it to the test again, and then continue to decline towards the region of $ 84.00 – $ 77.76.
An alternative would be the development of a complete correction towards the top. For starters, the price will have to exceed $ 106.00 and go to the first goal of $ 120.00. After fixing at these levels, we can expect growth in the region of $ 140.00 – $ 130.00.
XRP / USD
XRP / USD is trading at $ 0.30263 in the fix. In the medium term, the situation is not very different from the general market. However, on the chart of this coin, the accumulation area of $ 0.32000 – $ 0.29500 is very well seen. It is interesting to note that during the entire period of the formation of this "corridor", a new maximum has never been recorded. The dynamics of the price movement has not given any false hope that the current correction has at least some mention of a reversal of movement. The quotations of all time gradually fall in the zone of the minimum values of the whole fall. Therefore, there is also a high probability of updating the current lows and of continuing the downward trend. Reference points for the fall – levels of $ 0.28000 and $ 0.26000.

As part of the December 12 forecast, we can expect the continuation of the corrective movement in the range of $ 0.33950 – $ 0.28400. The signal area is at levels of $ 0.31600 – $ 0.31200. This is a dynamic area of the "balance" of the price of assets for the following day. The price will tend to return to this value after moving it higher or lower. For now, it's lower and there's a chance that the price will try again, and then continue to decline to $ 0.28300 – $ 0.26650.
An alternative would be the development of a complete correction towards the top. For starters, the price will have to exceed $ 0.34800 and reach the first goal of $ 0.37000. After fixing at these levels, we can expect growth in the region of $ 0.43000 – $ 0.40000.
XMR / USD
XMR / USD is trading at $ 42.99 and continues to fall. On the last trading day, the currency has updated the lows. The currency, as usual, anticipates all market movements. At the moment, we can say that the bearish trend has resumed. It is difficult to say now how strong this fall wave will be. The nearest landmark for the fall will be the area of $ 40,000 – $ 39,500. At these points, the coin is likely to satisfy the medium.

As part of the forecast for December 12, we can expect a further decline. The signal area is at $ 46,150 – $ 45,000. This is a dynamic area of the "balance" of the price of assets for the following day. The price will tend to return to this value after moving it higher or lower. For now, it is lower and it is likely that the price will put it to the test again, and then continue to decline in the region of $ 42,000 – $ 39,500.
An alternative would be the development of a complete correction towards the top. For starters, the price will have to exceed $ 60,000 and reach the first goal of $ 65,000. After fixing at these levels, we can expect growth in the region of $ 78,000 – $ 72,000.
