- Litecoin's price was under attack on Thursday, a 4% decline.
- LTC / USD touches the key rising trend line, ongoing since August 14th.
- The price has fallen within a downtrend channel and a bullish flag can be sustained on a larger scale.
LTC / USD 4-hour chart
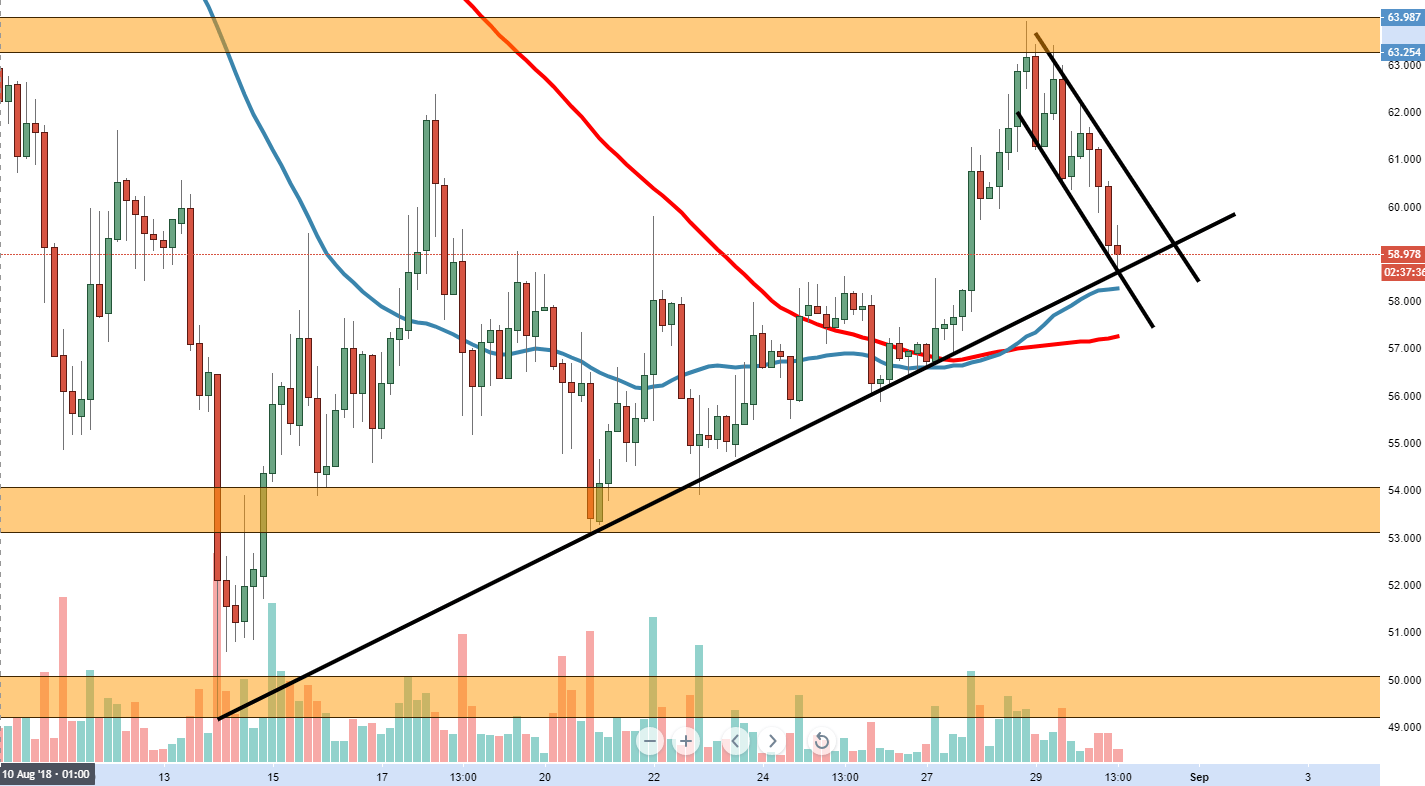
Spot rate: 59.180
Relative change: -3.86%
High: 61.667
Low: 58.606
Trend: Bearish
Support 1: 58.606, today (Thursday) low and the key rising trend line.
Support 2: 58.250, 50MA.
Support 3: 57.332, 100MA.
Resistance 1: 59.799. resistance on the 4-hour chart.
Resistance 2: 60.493, upper trend line of the descending and high channel of August 13th.
Resistance 3: 62.420, maximum of 18 August.
Get the 5 most predictable currency pairs
