[ad_1]
Introduction
In case you’re not familiar with my work on the Bitcoin Value Indicator, you can get caught up here. Essentially, I take raw data from Bitcoin (BTC-USD)(COIN)(OTCQX:GBTC) and compare it to the market cap. It turns out there are some very strong correlations. This data can help us determine where we are in the bubble cycle, potentially helping us to time entry or exit from the market.
Today we explore if this same technique can be used for Ethereum (ETH-USD).
The data
In order to perform these calculations, I’ll be using data from etherscan.io, a popular blockchain explorer for Ethereum. I’ll start off by using the same inputs that I used for the Bitcoin Value Indicator and see if we find a similar result. If not, we may need to change our approach.
It’s worth noting that Ethereum is the most widely used currency for ICOs, so we may need to find some way to quantify Dapp usage at some point.
A note about some differences
The data from Etherscan.io counts “total unique addresses” that have ever been used in a similar way that blockchain.com uses total transactions ever confirmed. So, it’s a different way of thinking about the data. Whereas the number of unique addresses in Bitcoin are nonzero addresses, the unique addresses in Ethereum are just the running total of addresses that have ever been used.
So, when you see “unique addresses” in this article, think “total transactions” in Bitcoin because that’s the closest comparison and I don’t want the terms to trip up my readers. Let’s get started.
Unique address growth
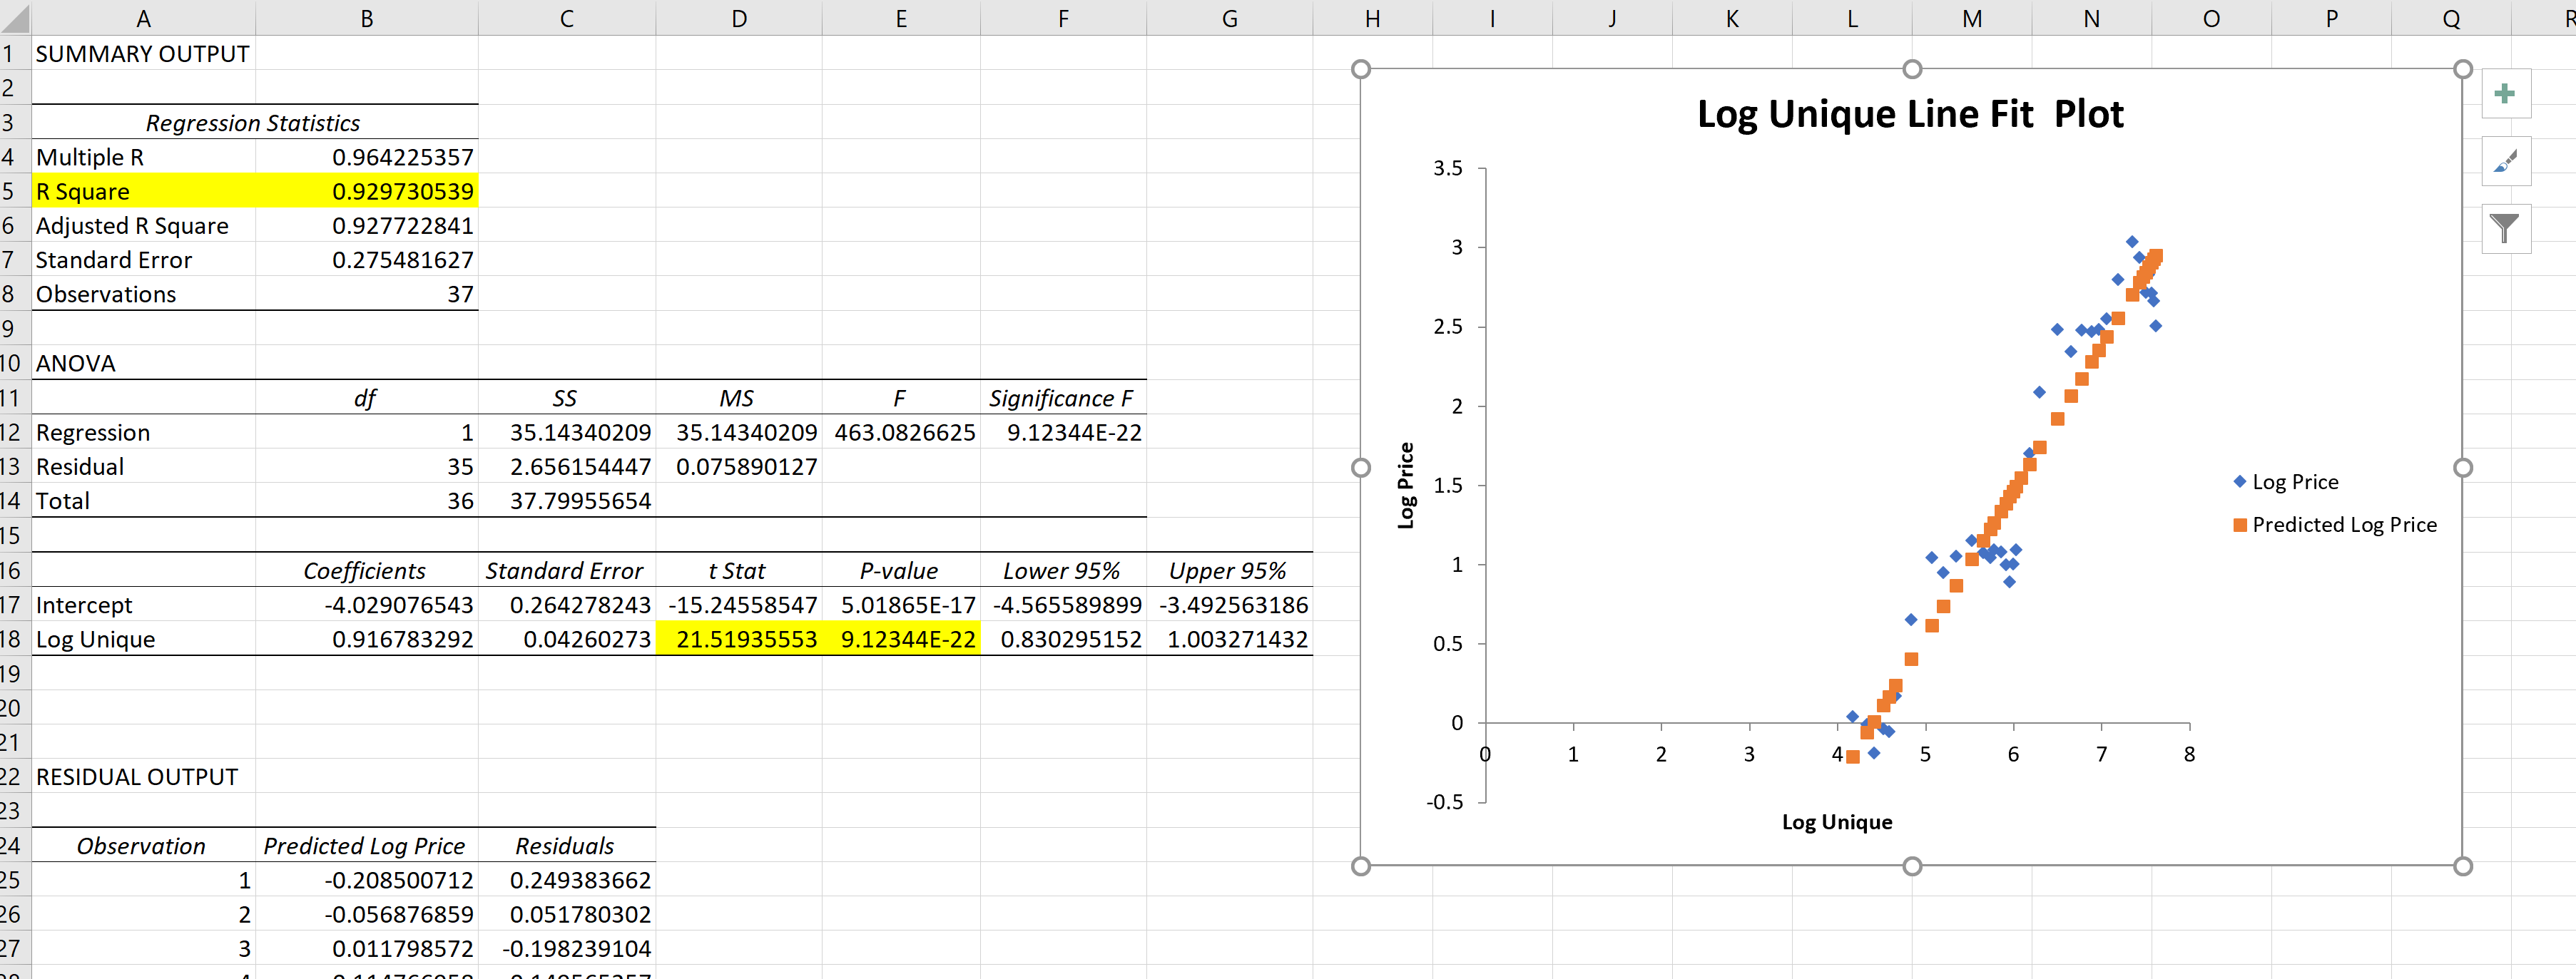
I downloaded the unique address growth data and placed it alongside the price of ETH, using a monthly average since there was a price. This gave me a data set from August 2015 until August 2018, about three years. I took the log base 10 of the price and compared it with the log base 10 of unique addresses. I used regression analysis from Excel’s data analytics package and these were the results.
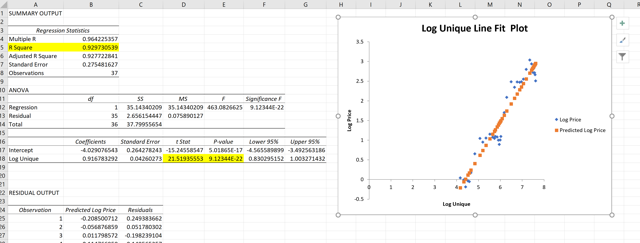 Image Source: Author’s Excel Spreadsheet
As you can see, we have a T-Score over 21, a P-Value far below 0.05, and an R-Square of just under 0.93, which is statistically significant.
Next, I used the regression equation to predict the log price, and then converted the log price back into linear price. Then, I divided the price by the prediction. With this data set, I then ran a Standardize function using the mean and standard deviation. This gave me a range of Z-scores, which I have plotted below.
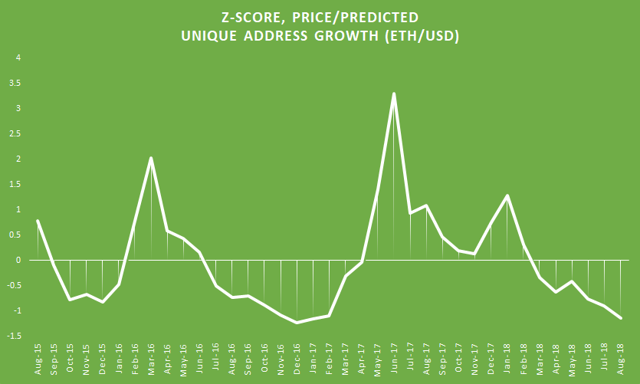
Image Source: Author’s Excel Spreadsheet
This very green chart would seem to indicate that the price of Ethereum today is lower than expected, by a wide margin. However, we need to keep in mind that this data set is much smaller than the ones we used with Bitcoin, which had nine years of data instead of three. Translation: Don’t make any decisions based off this chart alone; this is an experimental model (not financial advice).
Daily transactions
I used the same technique that I described above, but this time I compared the number of daily transactions (recorded on the blockchain, not from exchanges). This output was surprising…
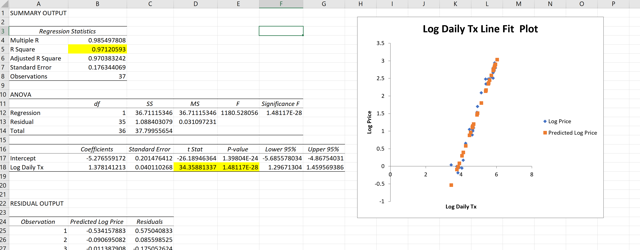 Image Source: Author’s Excel Spreadsheet
This R-Squared value is incredibly high, suggesting that there’s an unquestionable relationship between the actual usage of Ethereum and its market price. Essentially, the more it’s used, the more valuable it is. The P-value is very low, and the T-score is over 34, wow.
If you’re not sure what all this stats mumbo-jumbo means, just look at the chart. The orange dots are what Excel predicted, and the blue dots are reality. As you can see, the relationship is strong.
Looking at the blue Z-score chart, we see a similar story as the green one from earlier.
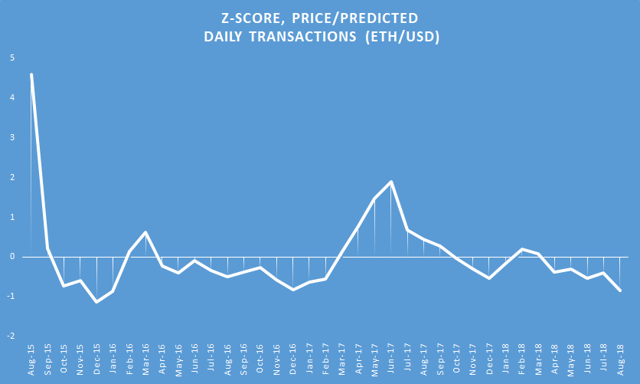
Image Source: Author’s Excel Spreadsheet
The price seems to be well below the predicted levels using this method, but again this approach is experimental, so take it with a grain of salt (or a heap of salt).
Network hash power
It may not surprise you that this method also produces a high level of correlation with the hash power of the network. Take a look below.
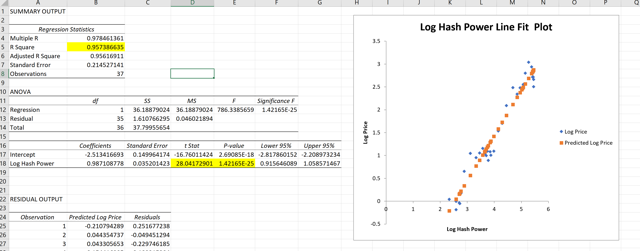 Image Source: Author’s Excel Spreadsheet
These figures are in line with the other two methods and meet the criteria for statistical significance (except with regards to the data set being normally distributed).
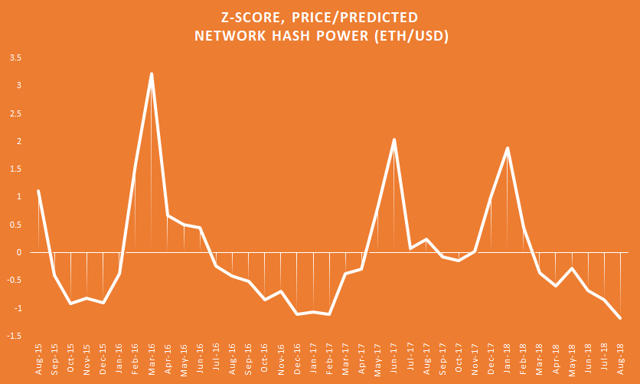
Image Source: Author’s Excel Spreadsheet
It’s worth noting that Ethereum will be switching to proof of stake, which should eliminate all mining. So this approach will stop working when that happens. However, proof of stake was supposed to be released with the platform three years ago, and after being pushed back several times, the plan is now for PoS at least a year from now.
Conclusion
All three approaches we tried were highly correlated with the price. Each would seem to suggest that Ethereum is priced too low. I urge caution, however, since the Ethereum network is still young and as I said earlier, we’re using a data set that’s 1/3 the size of the one we have for Bitcoin; so don’t go investing your life savings in ETH today based on these charts.
The fact that such a strong relationship exists between the output of the network and the price for both Bitcoin and Ethereum suggests that this approach could be used on any cryptocurrency with a similar structure. Of course, cryptocurrencies vary greatly in this regard as they do in terms of security and quality of code.
It’s too early for me to declare that we can make decisions based on this data, but I think it’s interesting for sure and I plan to keep an eye on it.
The price of a cryptocurrency is in the network. It’s that simple. If nobody was using Facebook (FB) or Twitter (TWTR), then how much value would those platforms have? I don’t think it’s too radical to say that there’s strong evidence that the same thing applies to Bitcoin, Ethereum, and probably many other cryptocurrencies. Adoption is the name of the game.
This article was published first in Crypto Blue Chips. Besides getting early access to research, you also get advanced metrics like the BVIPE each week and access to my actual portfolio. Stop by and check it out.
Disclosure: I am/we are long ETH-USD, BTC-USD.
I wrote this article myself, and it expresses my own opinions. I am not receiving compensation for it (other than from Seeking Alpha). I have no business relationship with any company whose stock is mentioned in this article.
[ad_2]
Source link
